
Open one service to see how to reach it, why it is awake, what it printed, and its own console.
Open a service
Section titled “Open a service”- Open the stack from Home.
- Double-click a service, or select it and press ⏎. From the List view, Open in the details pane does the same.
- Press esc to go back up to the stack.
doze open --show catalog # the app, at this service of the current projectdoze url catalog # its connect linedoze logs catalog # what it printedOverview
Section titled “Overview”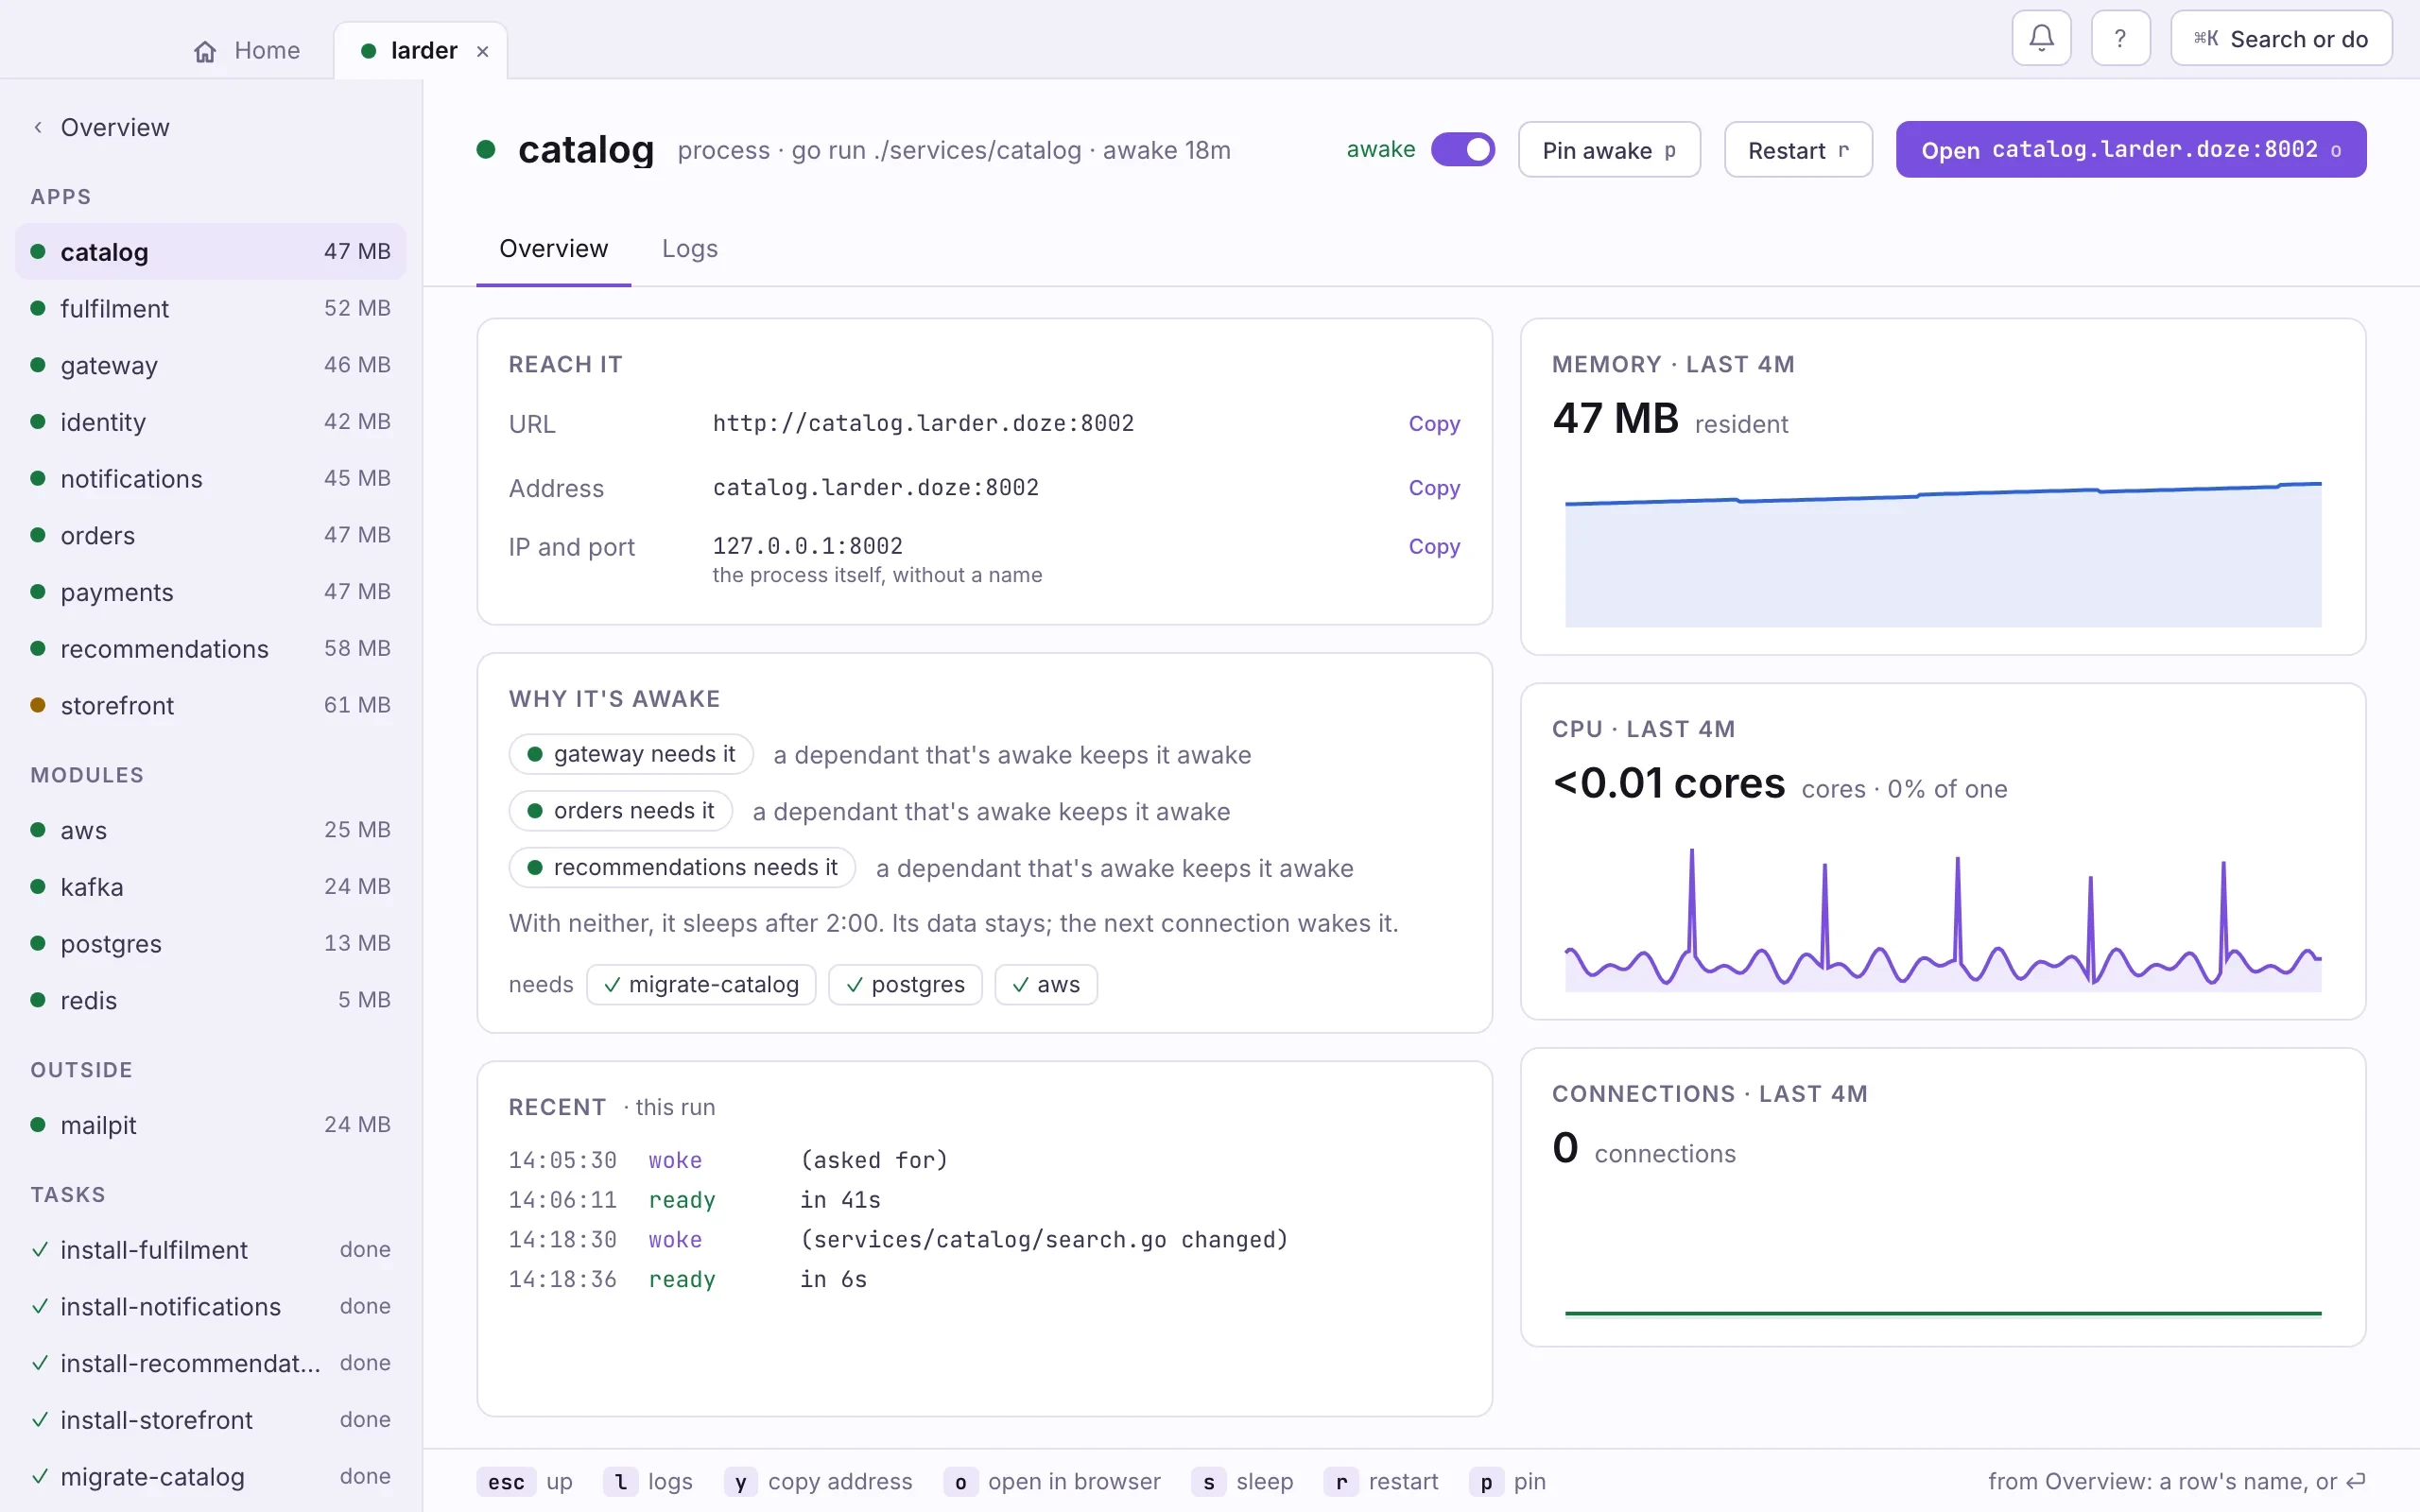
- The stack's services. Apps, modules, your own services and tasks, a click apart.
- Its switch and verbs. Wake or sleep, pin it awake, restart, open it in a browser.
- Reach it. Its URL, its name and port, and the bare IP and port. Each has Copy.
- Why it's awake. What holds it up, when it would sleep, and what it needs.
- Recent. When it woke, why, and how long it took to be ready, this run.
- The last four minutes. Memory, CPU and connections.
A module’s overview starts with a Connect card instead: the URL, the
environment variable an app would read it from, its name and port, and where its
data lives. Below it, From your code gives the same URL in Node, Python, Go,
a shell, .env and psql.
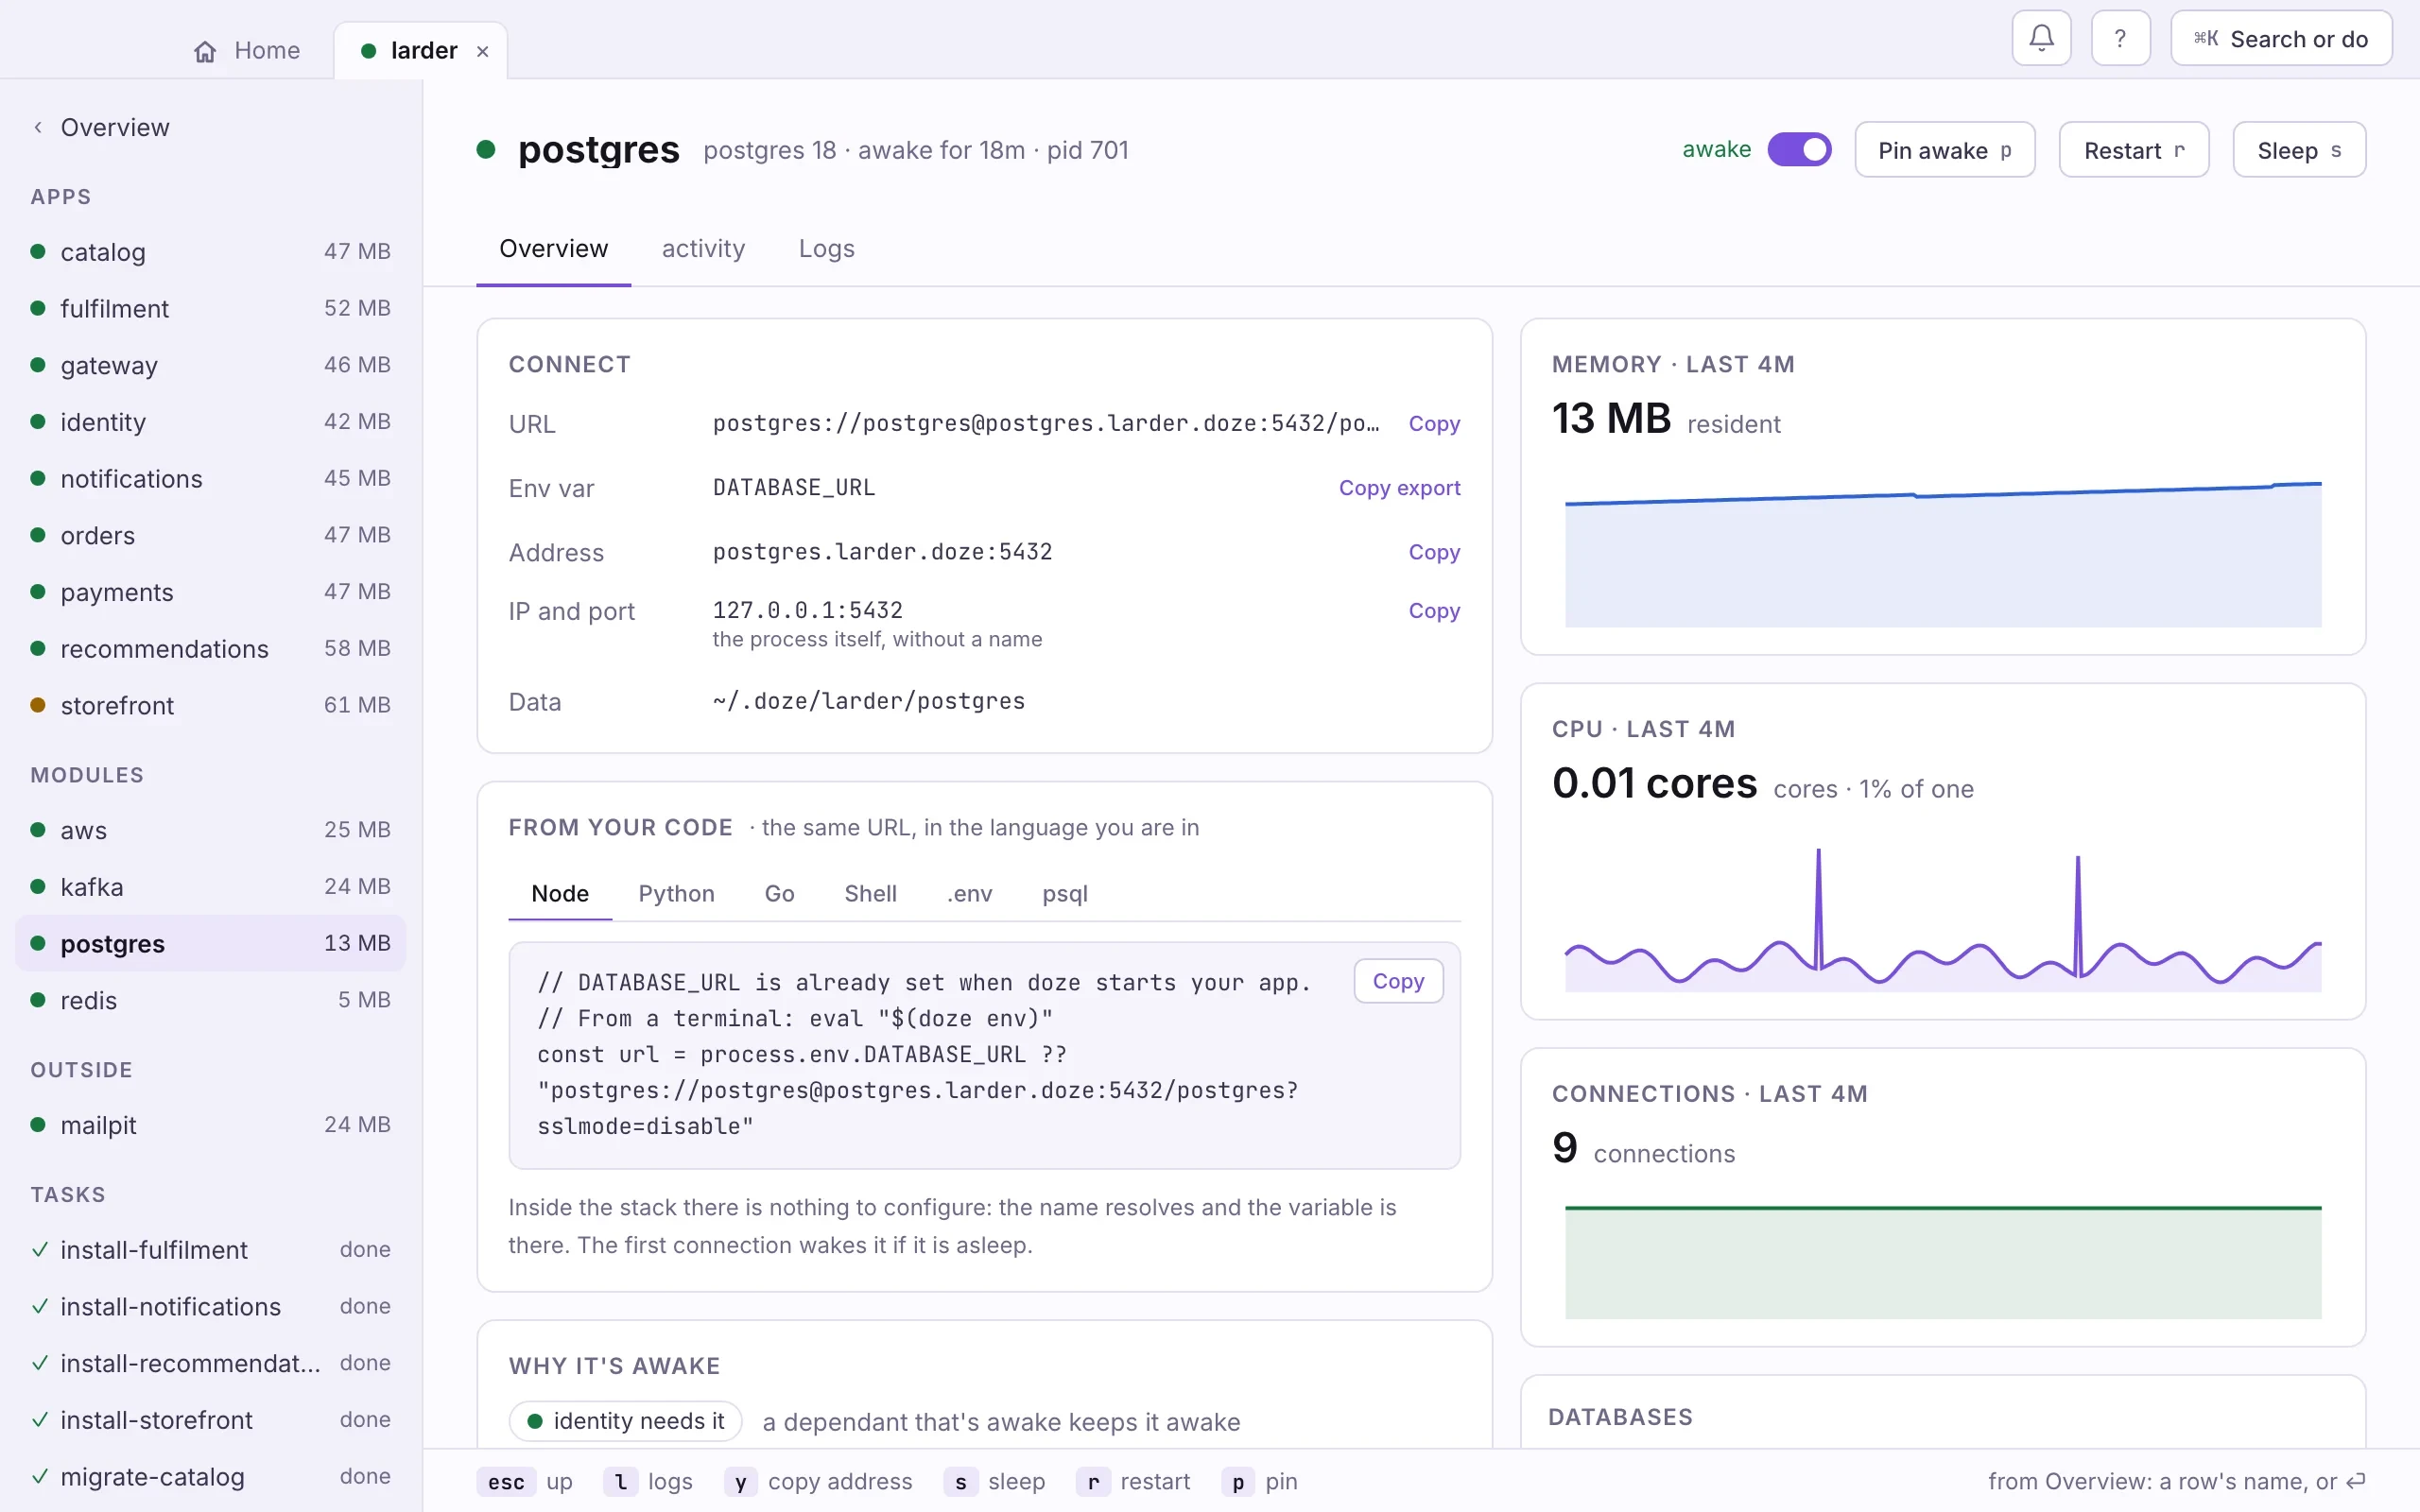
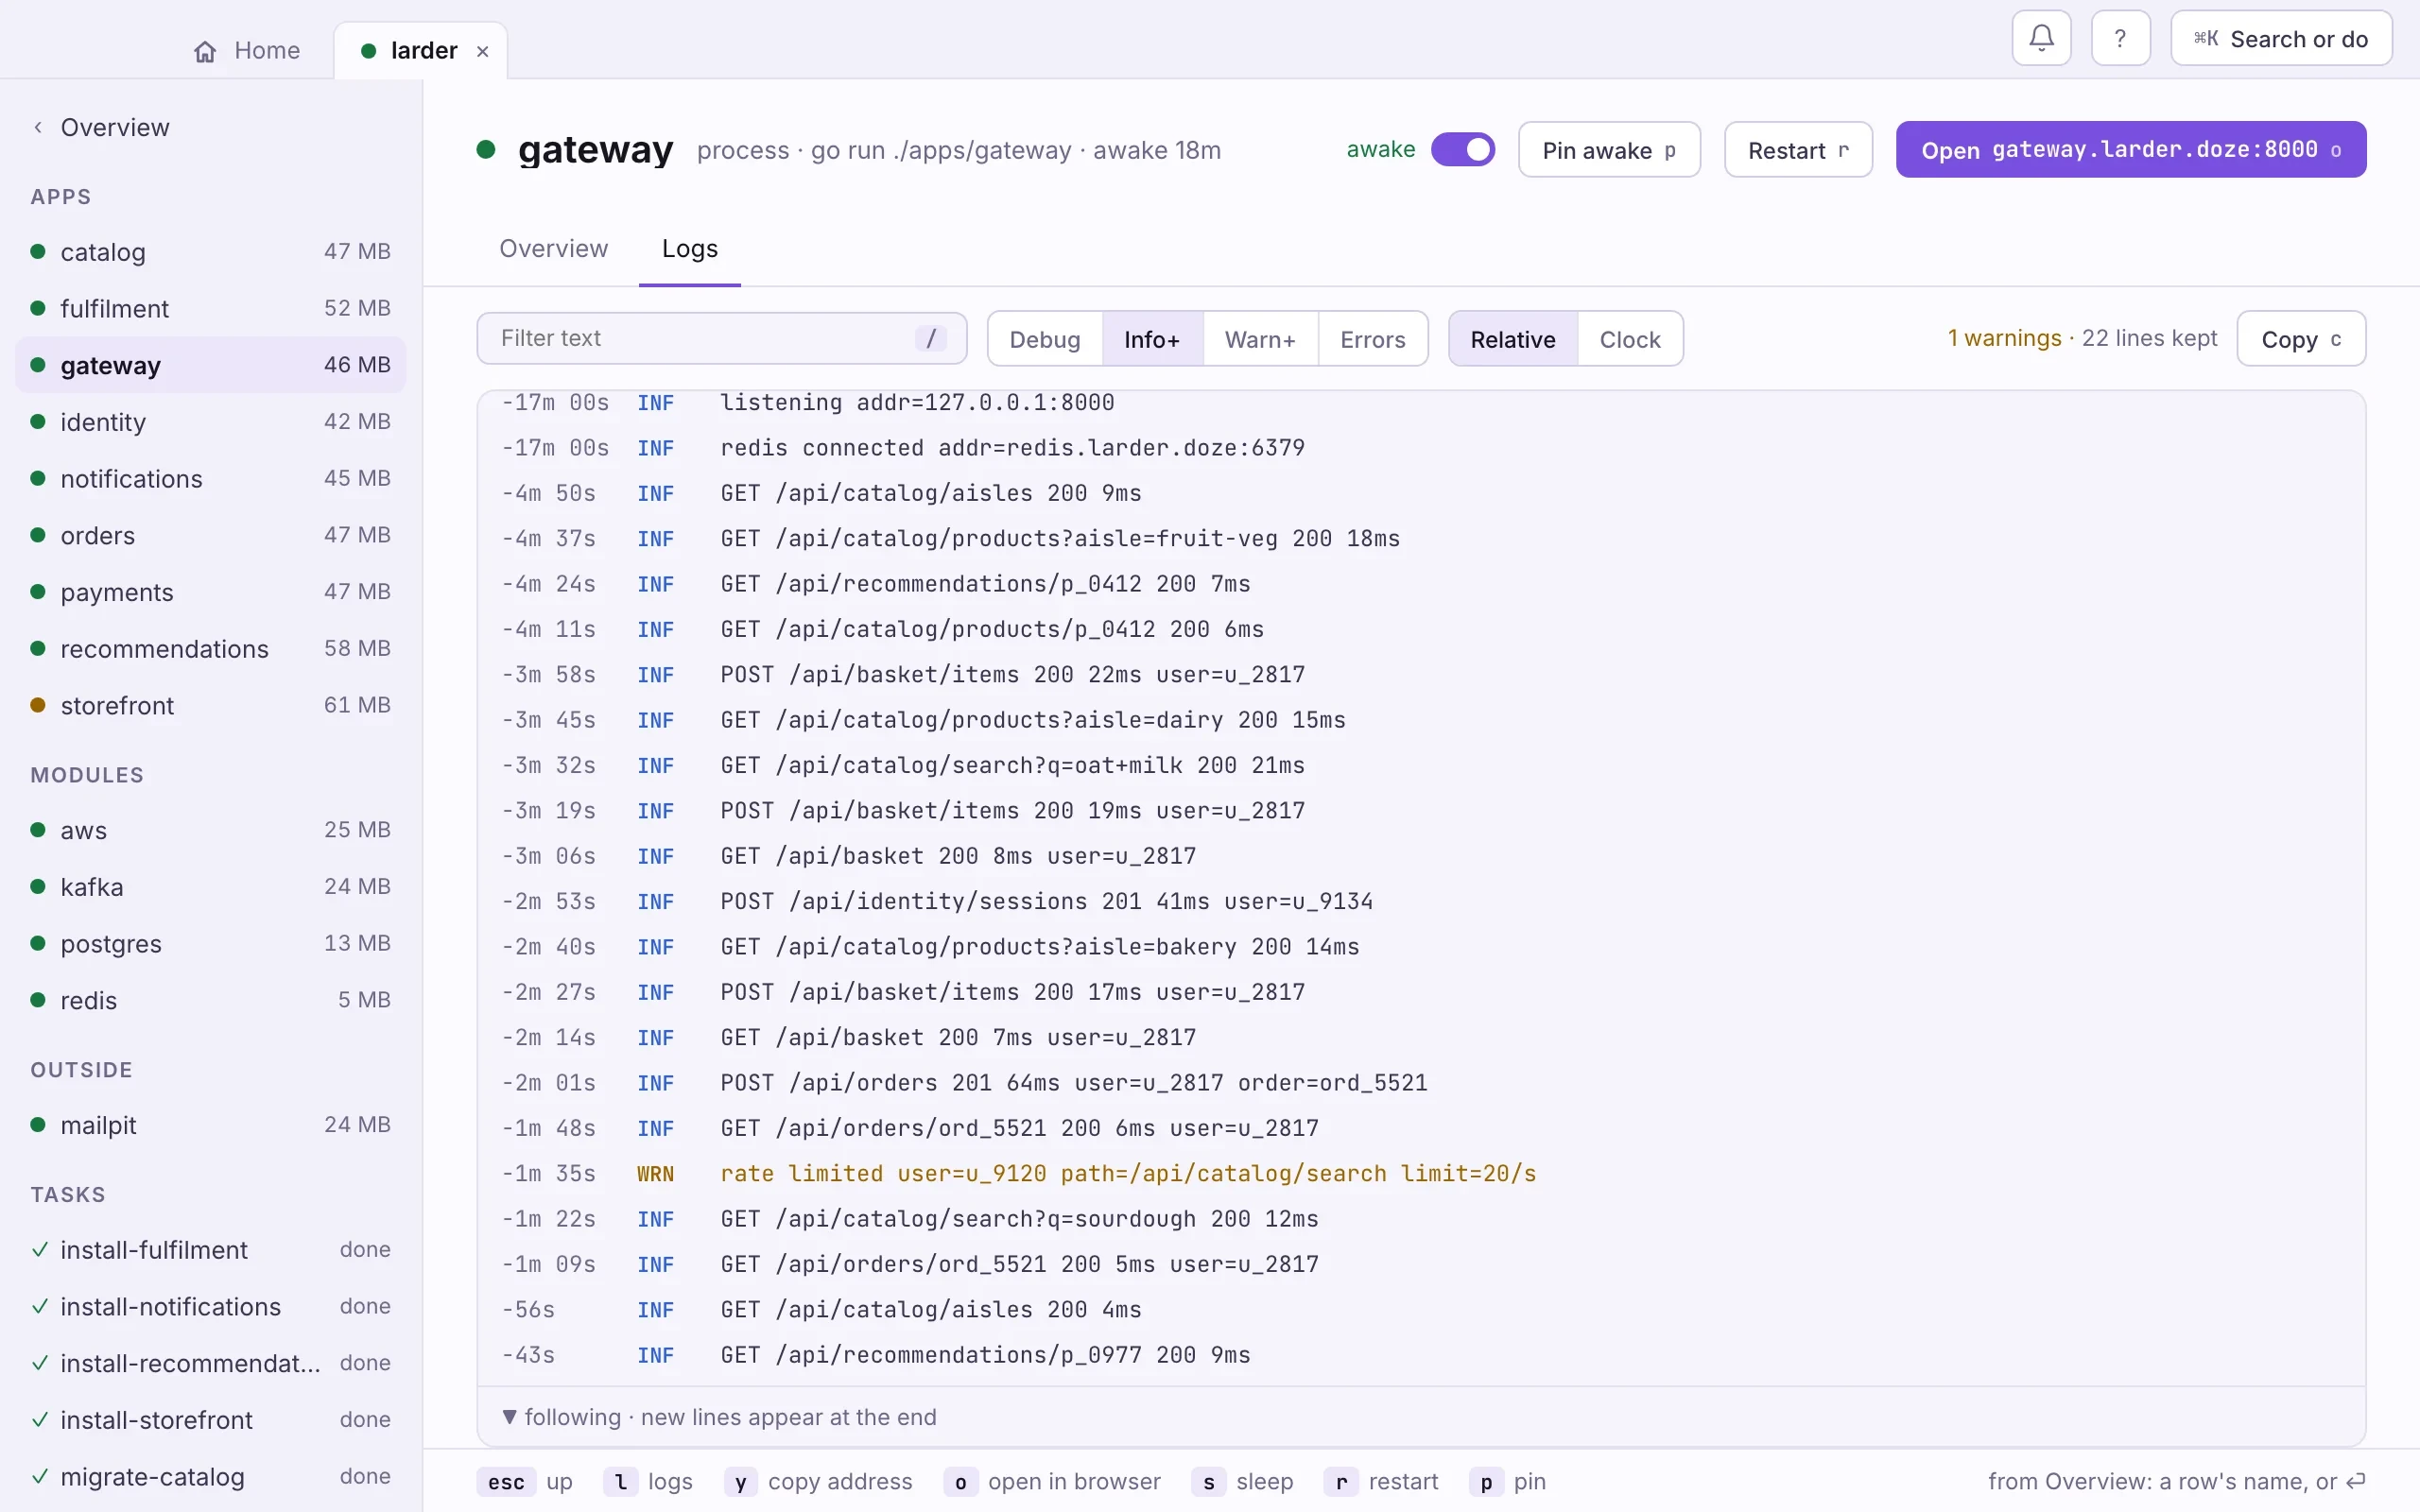
The Logs tab is what the service printed, following new lines as they come. Filter the text with /, pick a level from Debug to Errors, and switch between times relative to now and clock times. A service keeps its logs by run: [ and ] step to an earlier or later run. Copy copies what is shown.
All logs on the stack’s page (L, or ⌘L anywhere in the stack) merges every service’s lines, with a box per service to show or hide it.
Console
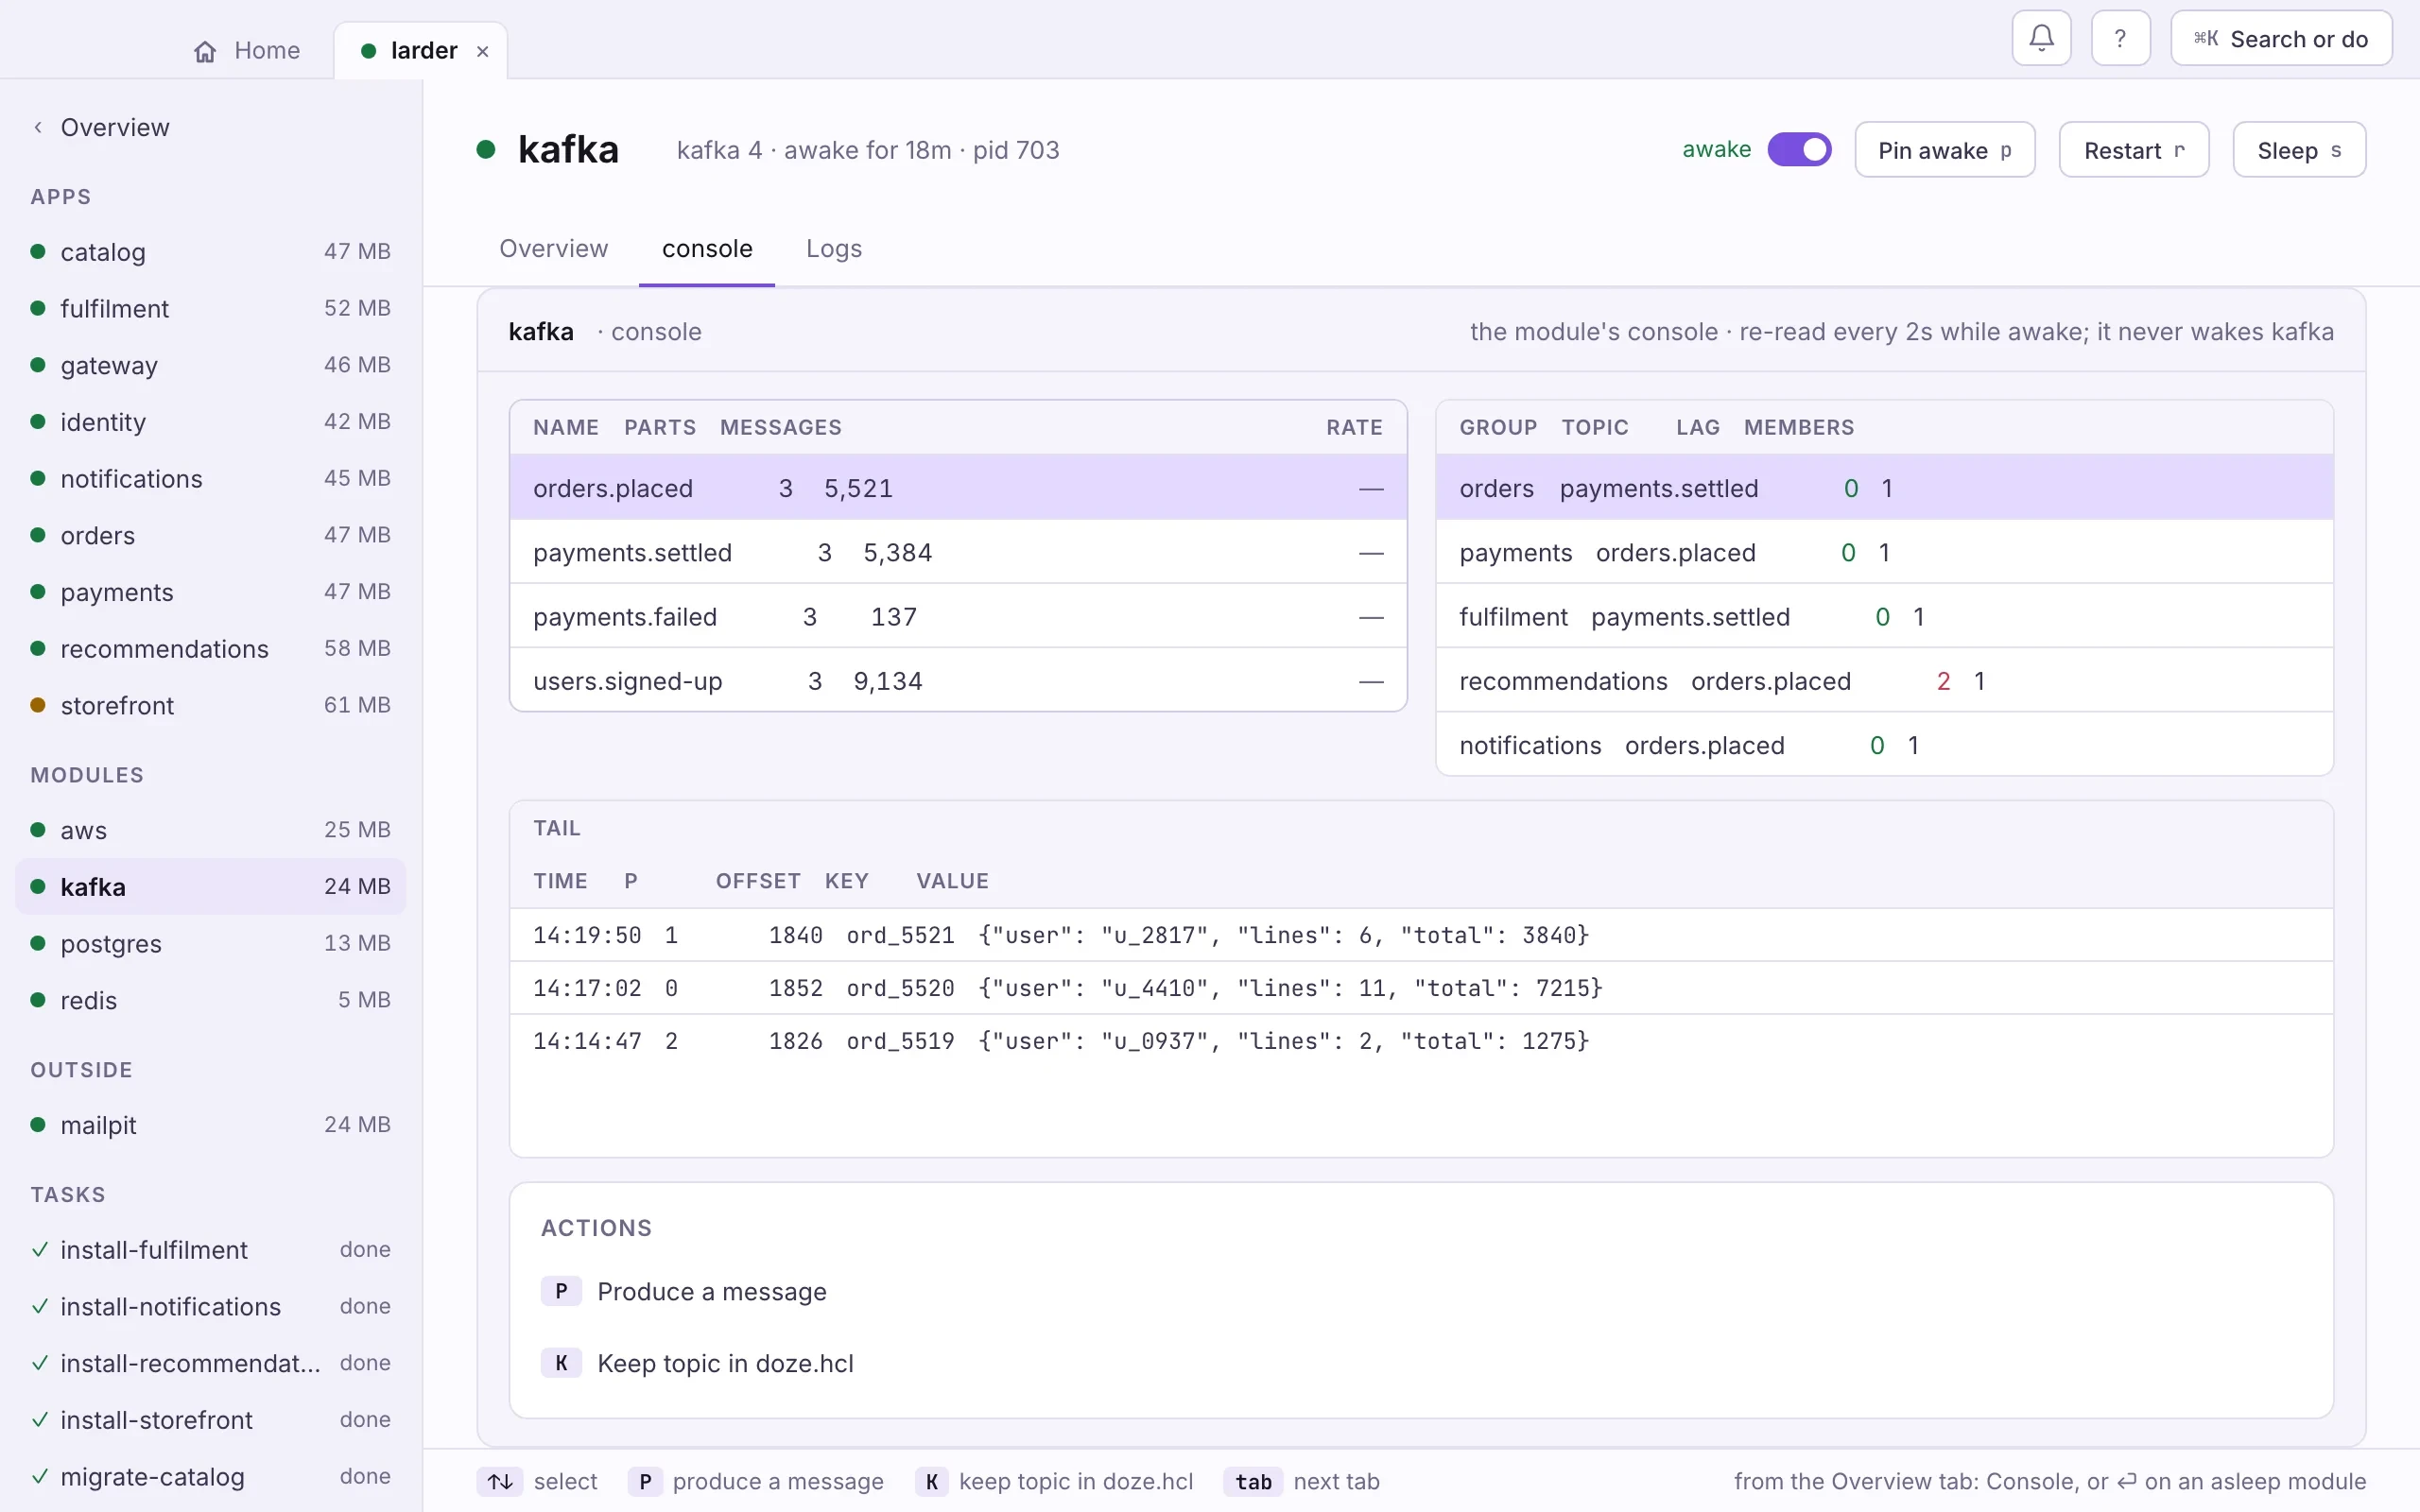
Section titled “Console”A module with a console of its own has a tab for it. Kafka’s lists the topics, the consumer groups and their lag, and the newest messages, and can produce a message. AWS’s shows its buckets and queues, and every API call, newest first. A console reads every two seconds while the module is awake and never wakes it. Postgres’s tab is activity: how many connections are active, idle and waiting.
A service that serves a web console, such as Larder’s mailpit, declares it with
console = "http://127.0.0.1:8025", and its page shows it in a Console tab,
with Open in browser (o) a key away.
While a console tab has the keyboard, its letters are its own actions; the page’s keys wait.
A task
Section titled “A task”A task’s page shows its Last run: the output, the exit code and how long it took. Runs lists the runs kept for the stack, newest first, with who or what started each. Run again (⏎) runs it now.
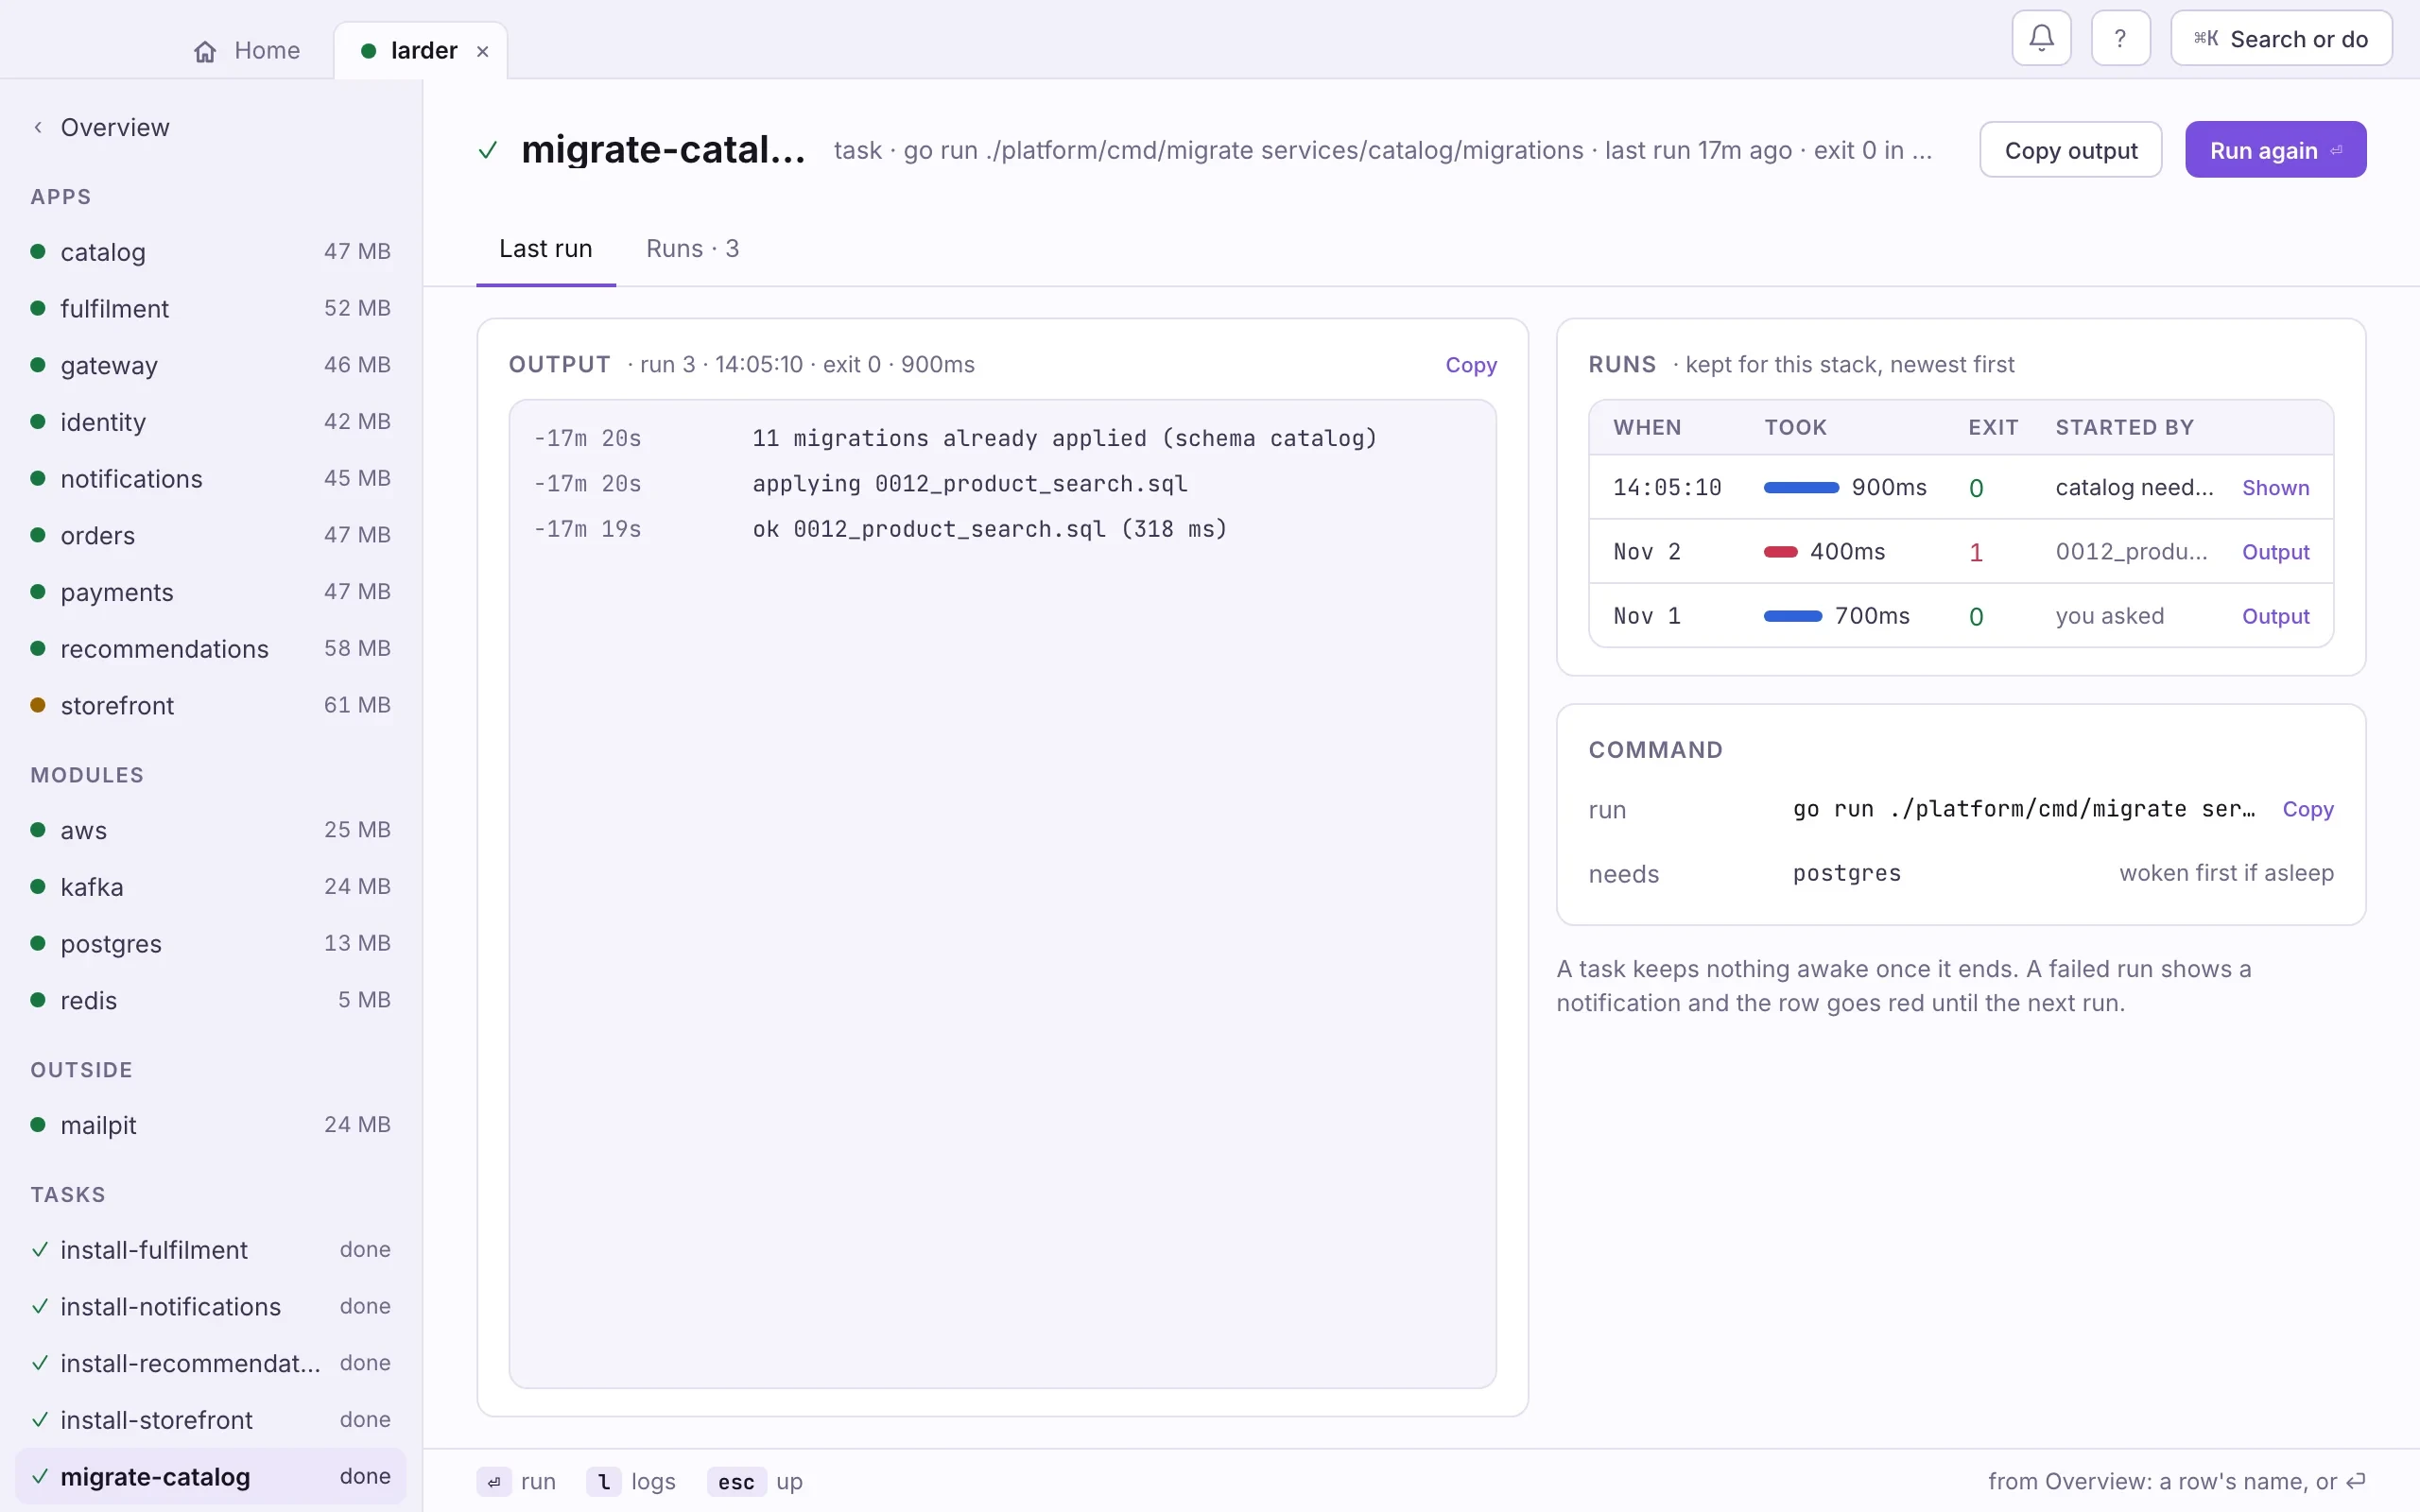
A task keeps nothing awake once it ends. A failed run shows a notification, and the task’s row stays red until the next run.
doze task # every task and how it last randoze task migrate-catalog # run it now- esc
- up to the stack
- w s
- wake, sleep
- p
- pin it awake, or unpin
- r
- restart (a task: run it)
- o
- open in a browser
- y
- copy its address
- l
- its logs
- ⏎
- a task: run it
On the Logs tab:
- /
- filter the text
- 1–4
- level: debug, info, warnings, errors
- t
- relative or clock time
- [ ]
- earlier, later run
- space
- pause or follow
- c
- copy what is shown
Next: When something breaks.